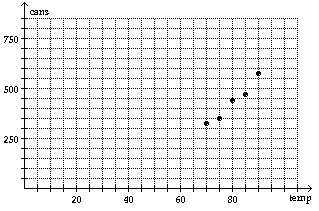
Provide an appropriate response.The table shows the number of cans of soda sold at a campus stand on five days with different high temperatures for the day. Write each paired data as an order pair of the form 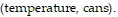 Then create a scatter diagram of the ordered pairs. Do the paired data show a trend. If so, what is the trend?
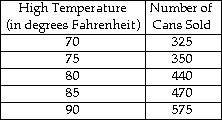
What will be an ideal response?
 ? ? |  |
Mathematics
You might also like to view...
Use the substitution formula to evaluate the integral.
A. - 
B. 
C. 
D. - 
Mathematics
The number of bacteria present at a given time under certain conditions is given by the equation Q = 4,000e 0.01t, where t is expressed in minutes. How many bacteria are present at the end of 45 minutes?Please round the answers to the nearest whole.
A. Q = 6,344 bacteria B. Q = 6,273 bacteria C. Q = 6,287 bacteria D. Q = 6,298 bacteria E. Q = 6,282 bacteria
Mathematics
The inverse of  is
?
is
?
A. 
B. 
C. 
D. 
Mathematics
Solve the exponential equation. Use a calculator to approximate the solution to the nearest thousandth.2x + 8 = 5
A. x ? -5.678 B. x ? 8.431 C. x ? -0.505 D. x ? 1.334
Mathematics