Solve the problem.Economists use what is called a Leffer curve to predict the government revenue for tax rates from 0% to 100%. Economists agree that the end points of the curve generate 0 revenue, but disagree on the tax rate that produces the maximum revenue. Suppose an economist produces this rational function,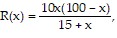 where R is revenue in millions at a tax rate of x percent. Use a graphing calculator to graph the function. What tax rate produces the maximum revenue? What is the maximum revenue?
A. 28.1%; $470 million
B. 29.7%; $467 million
C. 26.5%; $469 million
D. 31.4%; $464 million
Answer: C
Mathematics
You might also like to view...
For the given function:a) Describe an appropriate domain and range for the function.b) Make a rough sketch of a graph of the function. c) Briefly discuss the validity of your graph as a model of the true function.(size of truck, average fuel mileage)
What will be an ideal response?
Mathematics
Solve the equation by the method of your choice. Simplify irrational solutions, if possible.3x2 = 4x + 7
A. 
B. 
C. 
D. 
Mathematics
Find the domain.y = 
A. (-?, ?) B. (-?, 2) ? (2, ?) C. (-?, 5) ? (5, ?) D. (-?, -5) ? (-5, ?)
Mathematics
Write an equation that expresses the relationship. Use k as the constant of variation.c varies inversely as the square of v.
A. c = 
B. c = 
C. c = 
D. c = 
Mathematics