This graph demonstrates the domestic demand and supply for a good, as well as the world price for that good.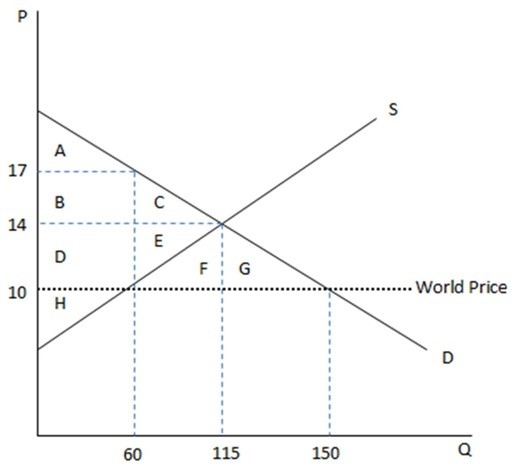 According to the graph shown, if this economy were to open to trade, domestic prices would:
A. remain $14 for domestically produced goods, and be $10 for those units imported.
B. drop to $10 for all units.
C. increase to $17 for all units sold.
D. remain $14, with more units sold overall.
Answer: B
You might also like to view...
Suppose the currency drain ratio is 25 percent and the desired reserve ratio is 20 percent. The money multiplier equals
A) 4.00. B) 5.42. C) 2.00. D) 2.78. E) 3.00.
Table 9-1 Output Consumption Investment Net Exports 1,000 800 500 100 1,500 1,200 500 100 2,000 1,600 500 100 2,500 2,000 500 100 3,000 2,400 500 100 3,500 2,800 500 100 4,000 3,200 500 100 ? In Table 9-1, inventories will be increasing as long as output is above
A. 1,000 B. 1,500 C. 2,000 D. 3,000
For a monopoly, marginal revenue is less than price because
A) the firm is a price taker. B) the firm must lower price if it wishes to sell more output. C) the firm can sell all of its output at any price. D) the demand for the firm's output is perfectly elastic.
If the MPS is 0.25, then the multiplier is 4.
Answer the following statement true (T) or false (F)