Plot and interpret the appropriate scatter diagram.The table shows the study times and test scores for a number of students. Draw a scatter plot of score versus time treating time as the independent variable. 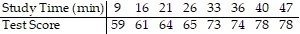 Effect of Study on Test Score
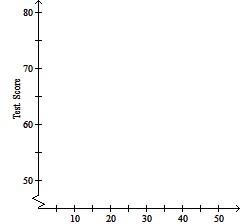 Time (min)
A. Effect of Study on Test Score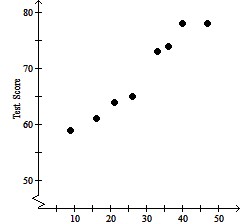
| Time (min) |
test scores.
B. Effect of Study on Test Score

| Time (min) |
test scores.
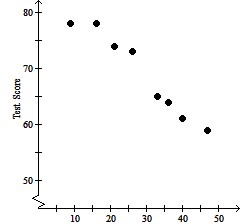
C. Effect of Study on Test Score

| Time (min) |
test scores.
D. Effect of Study on Test Score
| Time (min) |
test scores.
Answer: B
Mathematics
You might also like to view...
Determine the indicated component or components of the vector. Round to an appropriate number of significant digits.Magnitude = 69.3, ? = 33.3°Find the horizontal component of V.
A. 57.9 B. 95.9 C. 38.0 D. 19.9
Mathematics
Find the volume.Find the volume of the square-based pyramid.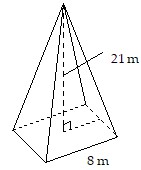
A. 1344 m3 B. 400 m3 C. 448 m3 D. 672 m3
Mathematics
Solve the inequality. Express your answer using interval notation.0 ?  < 3
< 3![]()
A. [-  ,
,  ]
]![]()
B. [-  ,
,  )
)![]()
C. (-  ,
,  )
)![]()
D. (-  ,
,  ]
]![]()
Mathematics
Graph the function.f(x) = 
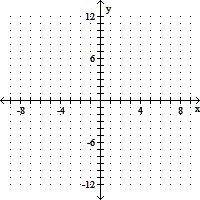
A. 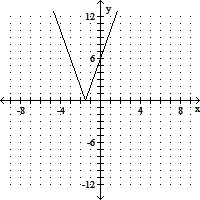
B. 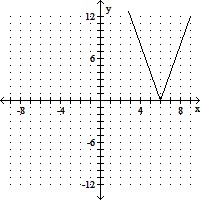
C. 
D. 
Mathematics