The bar graph shows the percent of income spent on leisure activities in various countries of the world. Use the graph to answer the question.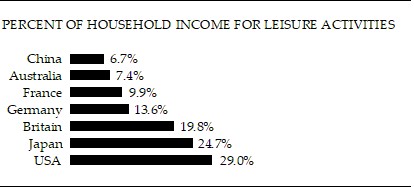 List all countries in the graph in which more than 12% of household income is spent, on average, for leisure activities.
A. Germany, Britain, Japan, USA
B. China, Australia, France
C. Britain, Japan, USA
D. Japan, USA
Answer: A
Mathematics
You might also like to view...
Simplify using the quotient rule.
A. 32 B. 264 C. 5 D. 248
Mathematics
Round following numbers as indicated.73.4365 (nearest hundredth)
A. 73.54 B. 73.4365 C. 73.44 D. 73.34
Mathematics
Graph the function over a one-period interval.y =  sin (x + ?)
A. 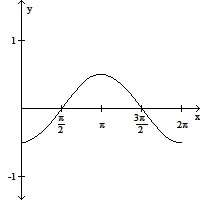
B. 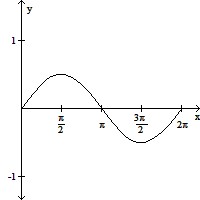
C. 
D. 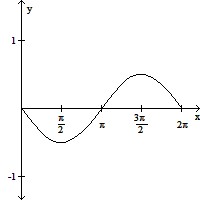
Mathematics
Solve the inequality graphically. Express the solution in set-builder notation. <
< 
A. { x <
x <  }
}
B. { x <
x <  }
}
C. { x >
x >  }
}
D. { x >
x >  }
}
Mathematics