Refer to the accompanying figure. A decrease in supply is represented by a shift from: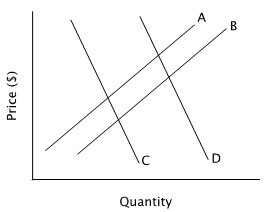
A. curve C to curve D.
B. curve A to curve B.
C. curve D to curve C.
D. curve B to curve A.
Answer: D
You might also like to view...
The marginal propensity to consume (MPC)
A) shows the percentage of real disposable income consumed at each level of income. B) shows how much of an extra dollar of real disposable income is spent. C) shows how much real disposable income changes when consumption falls. D) is greater than 1 only if the marginal propensity to save is greater than 1.
Suppose a perfectly competitive market is in long-run equilibrium. If there is a permanent increase in demand,
A) at least in the short run, some firms will increase their output. B) at least in the short run, the price will increase initially. C) new firms will enter the market. D) All of the above answers are correct.
In a large open economy like the United States, an increased government budget deficit which reduces national saving
A) reduces investment and improves the current account balance. B) reduces investment and reduces the current account balance. C) has no effect on investment, but reduces the current account balance. D) has no effect on either investment or the current account balance.
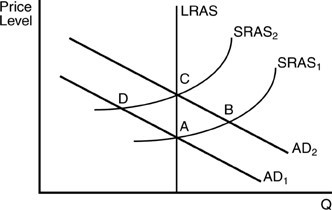 In the above figure, suppose the economy is currently in equilibrium at point C. Applying rational expectations theory, what happens if the Fed announces that it is decreasing the money supply and follows through on its statement?
A. Real Gross Domestic Product (GDP) per year will increase. B. The price level will increase. C. The price level will decrease. D. Real Gross Domestic Product (GDP) per year will decrease.