Solve the problem.The following data represents the normal monthly precipitation for a certain city. 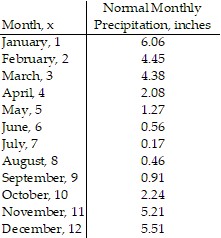 Draw a scatter diagram of the data for one period. Find a sinusoidal function of the form
 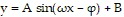 that fits the data. Draw the sinusoidal function on the scatter diagram. Use a graphing utility to find the sinusoidal function of best fit. Draw the sinusoidal function of best fit on the scatter diagram.
What will be an ideal response?
y = 3.14 sin(0.46x + 1.53) + 3.16;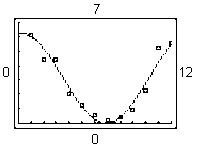
You might also like to view...
Factor completely. If unfactorable, indicate that the polynomial is prime.x3 - 36x + 4x2 - 144
A. prime B. (x2 - 36)(x + 4) C. (x + 6)(x - 6)(x + 4) D. (x - 6)2(x + 4)
Provide an appropriate response.Find all of the higher-order derivatives of x(t) = x4 - 3x2 - x. Use your graphing calculator to graph x(t) and x'(t) on the same axes. Verify that when x(t) is decreasing (sloping downward), the value of x'(t) is negative. Repeat this for x'(t) and x''(t), for x''(t) and x'''(t), and for x'''(t) and x(4)(t).
What will be an ideal response?
Provide the proper response.When we define the definite integral, what is a necessary condition for the function f(x)?
A. We must be able to draw the graph of f(x). B. f(x) must be continuous on some interval [a,b]. C. f(x) must be continuous everywhere. D. f(x) must be positive on some interval [a,b].
Solve the equation. =
= 
A. {0} B. {3} C. {-6} D. {6}