Solve the problem.The sales for a gaming console for various years are listed in the table below. 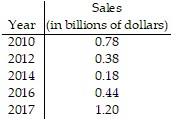 Let f(t) represent the sales (in billions of dollars) at t years since 2008. A reasonable model is
 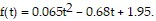 According to the model, when were sales at a minimum? What were the sales in that year?
A. 2014; $180 million
B. 2013; $166 million
C. 2013; $172 million
D. 2015; $170 million
Answer: C
You might also like to view...
Simplify the algebraic expression.2[4x2 - 7(-8 - x)]
A. 8x2 + 7x + 56 B. 8x2 + 14x + 112 C. 8x2 - 2x + 112 D. 8x2 - 14x + 112
Consider the logistic equation. Find the equilibrium solutions. A detailed direction field is not needed. Assume  and
and  P'(t) = 0.05P
A. P = 0 and P = 800 B. P = 0 and P = 200 C. P = 0 and P = 400 D. P = 400
The graph of a certain function y = f(x) and the zero of that function is given. Using this graph, find a) the x-intercept of the graph of y = f(x) and b) the solution to the equation f(x) = 0.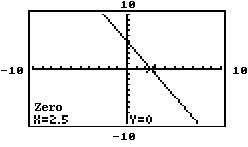
A. a. 0 b. x = 2.5 B. a. -2.5 b. x = -2.5 C. a. 2.5 b. x = 0 D. a. 2.5 b. x = 2.5
Solve the problem.The number of students receiving a diploma from a local high school for the years 2000 through 2035 can be projected by the function y = -0.275x2 + 6.05x + 260, where x is the number of years after 2000.a. Is the vertex of the graph of this function a maximum or a minimum?b. Find the input and output at the vertex. Round to the nearest tenth when appropriate.
A. a. minimum b. (15, 293.3) B. a. maximum b. (11, 393.3) C. a. maximum b. (11, 293.3) D. a. minimum b. (11, 293.3)