Refer to the graphs below. A price increase from $20 to $40 causes quantity demanded to decrease from 100 units to 50 units. Which graph best illustrates the demand for this good?
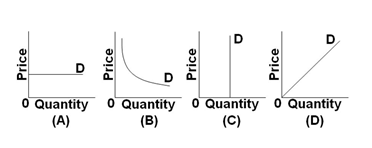
A. Graph A
B. Graph B
C. Graph C
D. Graph D
B. Graph B
You might also like to view...
The labor force includes
A) only the number of people employed. B) discouraged workers. C) only the number of people unemployed. D) both employed and unemployed workers.
Human capital is defined as
a. the skills and knowledge possessed by workers b. the tools used by labor c. equipment and machinery used to train workers d. buildings purchased by households rather than by businesses e. equipment and machinery used to aid household production and increase available leisure time
Domestic monetary policy is essentially useless under
a. a floating exchange rate system. b. a fixed exchange rate system. c. the gold standard. d. conditions of balance of payments surpluses.
The market in which households supply their savings to firms that demand funds in order to buy capital goods is the ________ market.
A. investment B. money C. capital D. savings