Analyze the graph of the given function f as follows:(a) Determine the end behavior: find the power function that the graph of f resembles for large values of |x|.(b) Find the x- and y-intercepts of the graph.(c) Determine whether the graph crosses or touches the x-axis at each x-intercept.(d) Graph f using a graphing utility.(e) Use the graph to determine the local maxima and local minima, if any exist. Round turning points to two decimal places.(f) Use the information obtained in (a) - (e) to draw a complete graph of f by hand. Label all intercepts and turning points.(g) Find the domain of f. Use the graph to find the range of f.(h) Use the graph to determine where f is increasing and where f is decreasing.f(x) = (x + 3)(x - 2)2
What will be an ideal response?
(a) For large values of |x|, the graph of f(x) will resemble the graph of y = x3.
(b) y-intercept: (0, 12), x-intercepts: (2, 0) and (-3, 0)
(c) The graph of f crosses the x-axis at (-3, 0) and touches the x-axis at (2, 0).
(e) Local minimum at (2, 0); Local maximum at (-1.33, 18.52)
(f) 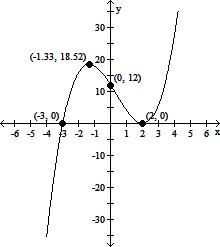
(g) Domain of f: all real numbers; range of f: all real numbers
(h) f is increasing on (-?, -1.33) and (2, ?); f is decreasing on (18.52, 2)
You might also like to view...
Use integration by parts to establish a reduction formula for the integral. , n ? 1
A.  = secn-2 x tan x + (n - 2)
B.  = secn-2 x tan x - (n - 2)
C.  =
=  secn-2 x tan x +

D.  =
=  secn x tan x -

gr 20 = ? mg
A. 60mg B. 1.2mg C. 1200mg D. 600mg
Solve the problem.Rats are kept in a cage with two compartments (A and B). Rats in A move to B with probability 0.5. Rats in B move to A with probability 0.3. Find the long-term trend for rats in each compartment. Round numbers to the nearest thousandth.
A. 
B. 
C. 
D. 
Find u ? v.u =  , v =
, v = 
A. 34 B. -18 C. -27 D. 38