Refer to the graph shown. If this graph represents a competitive market, the equilibrium price and quantity will be: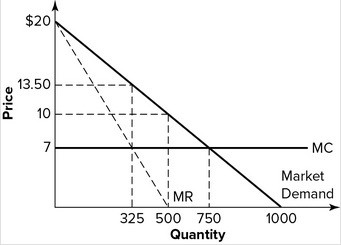
A. $13.50 and 325, respectively.
B. $10 and 500, respectively.
C. $7 and 750, respectively.
D. $7 and 325, respectively.
Answer: C
You might also like to view...
In the above figure, at a price of $8, a perfectly competitive firm produces ________ and it ________
A) 0; incurs an economic loss B) 0; makes zero economic profit C) some output; makes zero economic profit D) some output; makes an economic profit
In the presence of external economies of scale, trade
A) may or may not improve welfare in both countries. B) will unambiguously improves welfare in both countries. C) will unambiguously worsens welfare in both countries. D) will unambiguously worsen welfare in the exporting country and improve welfare in the importing country. E) will unambiguously improve welfare in the exporting country and worsen welfare in the importing country.
Diversification is most effective in reducing:
A) market risk B) systemic risk C) idiosyncratic risk D) all forms of risk
Which of the following ultimately must decide what externalities should be addressed?
A. Consumers B. Firms C. The market D. Government