Refer to the information provided in Figure 2.4 below to answer the question(s) that follow.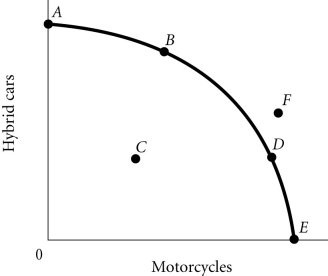 Figure 2.4Refer to Figure 2.4. The economy moves from Point E to Point B. This could be explained by
A. a change in society's preferences for hybrid cars versus motorcycles.
B. an increase in economic growth.
C. an increase in unemployment.
D. a reduction in unemployment.
Answer: A
You might also like to view...
Suppose bad weather in Florida unexpectedly results in a much smaller citrus crop than had been projected. This would tend to cause the labor demand curve for citrus pickers to shift to the
A) left, increasing wages. B) right, increasing wages. C) left, decreasing wages. D) right, decreasing wages.
One reason the total sum of the income categories does not equal GDP is that
A) taxes are generally larger than subsidies and the depreciation of capital is negligible. B) GDP values goods and services at retail prices and the income approach values them at wholesale cost. C) people do not spend all their income, so the value of consumption expenditure is less than the value of wages. D) GDP does not include depreciation, which is part of the income categories. E) GDP values goods and services at market prices and the income approach values them at factor cost.
Under a flexible exchange rate system, an increase in the value of a domestic currency in terms of other currencies is referred to as
A) an appreciation. B) a depreciation. C) a devaluation. D) a revaluation.
Which of the following stock market decreases is best explained by the notion of a bubble collapsing?
A. The early-1982 drop in the DJIA B. The U.S. stock market's drop in late-2008 C. The decade of the 1970s D. The Japanese stock market in late-1990