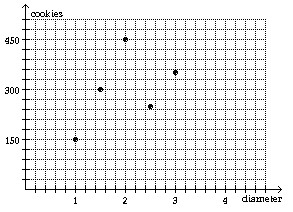
Provide an appropriate response.The table shows the number of cookies sold at a bake sale according to their diameter in inches. Write the ordered pair data as an ordered pair of the form (diameter, number sold). Then create a scatter diagram of the ordered pairs. Do the paired data show a trend. If so, what is the trend?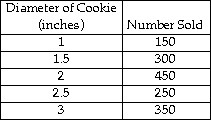
What will be an ideal response?
 ? ? |  |
Mathematics
You might also like to view...
Subtract in the indicated base.
A. EFD16 B. FDC16 C. FCF16 D. FDF16
Mathematics
Convert.36 cm = ___ m
A. 0.36 B. 3600 C. 0.036 D. 36,000
Mathematics
Perform the indicated operations. -
-  +
+ 
A. 
B. 
C. 
D. 
Mathematics
Find an equation for the hyperbola described. Graph the equation.Focus at ( , 0); vertices at (-5, 0), (5, 0)
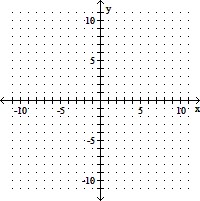
A.  -
-  = 1
= 1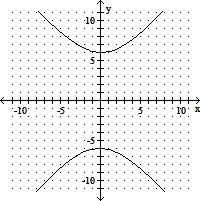
B.  -
-  = 1
= 1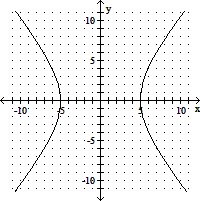
C.  -
-  = 1
= 1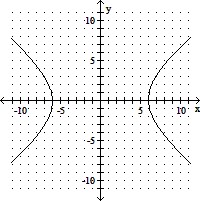
D.  -
-  = 1
= 1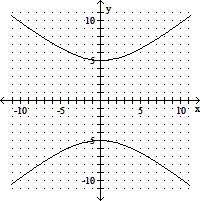
Mathematics