In the graph shown, what represents the trade deficit?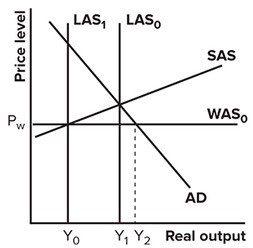
A. Y2 - Y0
B. Y0
C. Y1
D. Y2 - Y1
Answer: A
You might also like to view...
Why do economists prefer to use the model of perfect competition in most economic analysis?
Which of the following is most likely to favor tariffs on imports?
The Herfindahl-Hirschman Index is the sum of the
A. Market shares of the top four firms in the market. B. Squared concentration ratios for the firms in the market. C. Squared market shares of the firms in the market. D. Market shares of all the firms in the market.
When the production of one good spills benefits over to third parties, the government should consider all of the following EXCEPT
A. subsidizing the consumption of the good. B. taxing the production or consumption of the good. C. subsidizing the production of the good. D. creating tax incentives to encourage more consumption.