Determine whether the data represent direct variation, inverse variation, or neither.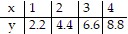
A. Inverse
B. Neither
C. Direct
Answer: C
You might also like to view...
The table below shows the value V, in dollars, of a certain rare coin t years since 1950. t 0 30 45 54 60 V 30 402 654 1840 2151? A: Use exponential regression to model V as a function of t. Round your answer to two decimal places.B: Plot the exponential model along with the data points.C: According to the exponential model, what is the value of the coin in 2015? Round your answer to the nearest cent.
What will be an ideal response?
Solve the problem.Various measurements for the length of a building are taken, yielding  Express the possible lengths x as an inequality and graph the values of x.
![]() x = length of building in ft
x = length of building in ft
A. 251 ? x ? 257![]() x = length of building in ft
x = length of building in ft
B. x < 251 or x > 257![]() x = length of building in ft
x = length of building in ft
C. 251 < x< 257![]() x = length of building in ft
x = length of building in ft
D. x ? 251 or x ? 257![]() x = length of building in ft
x = length of building in ft
Provide an appropriate response.In right triangle ABC with right angle C, find the indicated part. Round to four significant digits. Find b if A = 21° and c = 13 ft.
Fill in the blank(s) with the appropriate word(s).
Solve the problem.On April 1, the unpaid balance in an account was $232. A payment of $50 was made on April 13. On April 17 a $17 purchase was made. The finance charge rate was 1.75% per month of the average daily balance. Find the new balance at the end of April.
A. $235.54 B. $200.75 C. $202.67 D. $185.54