Exhibit 6-6 Total cost curves
?
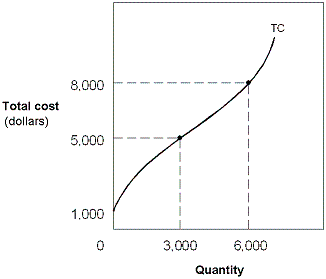
In Exhibit 6-6, the total fixed cost is:
A. 0.
B. 1,000.
C. 3,000.
D. 5,000.
Answer: B
You might also like to view...
Refer to Table 4-8. Suppose that the quantity of labor supplied decreases by 40,000 at each wage level. What are the new free market equilibrium hourly wage and the new equilibrium quantity of labor?
A) W = $9.50; Q = 370,000 B) W = $10.00; Q = 350,000 C) W = $9.00; Q = 330,000 D) W = $8.00; Q = 390,000
An increase in lifetime wealth
A) increase current labor supply and increase current consumption demand. B) increase current labor supply and decrease current consumption demand. C) decrease current labor supply and increase current consumption demand. D) decrease current labor supply and decrease current consumption demand.
Which of the following would be included in a person's life-cycle wealth?
a. savings account b. refrigerator c. stock in a corporation d. government savings bonds e. income
An investor who felt that the U.S. and world economies were about to improve, would be likely to
A) avoid investing in U.S. treasury bonds because interest rates would soon fall causing bond prices to rise. B) avoid investing in U.S. treasury bonds because interest rates would soon rise causing bond prices to fall. C) invest in U.S. treasury bonds because interest rates would soon fall causing bond prices to rise. D) invest in U.S. treasury bonds because interest rates would soon rise causing bond prices to fall.