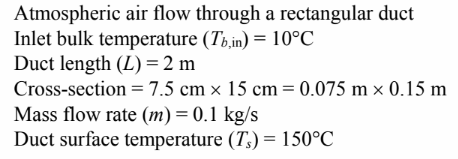
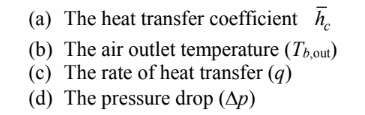
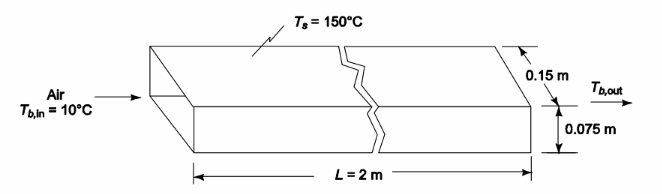
Atmospheric air at 10°C enters a 2 m long smooth rectangular duct with a 7.5 cm x 15 cm cross-section. The mass flow rate of the air is 0.1 kg/s. If the sides are at 150°C, estimate (a) the heat transfer coefficient, (b) the air outlet temperature, (c) the rate of heat transfer, and (d) the pressure drop.
GIVEN
FIND
ASSUMPTIONS
Steady state
The duct is smooth
SKETCH
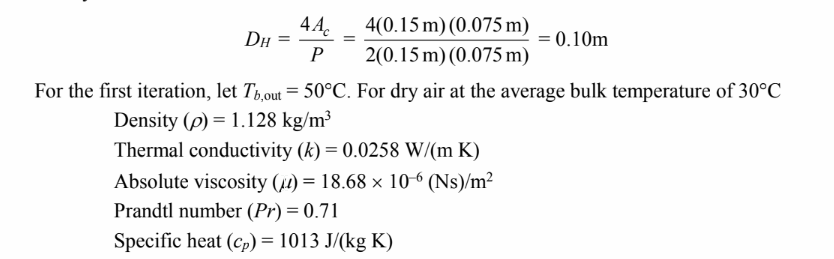
The hydraulic diameter of the duct is
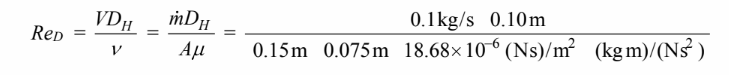
The Reynolds number is
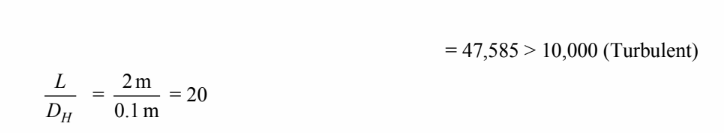
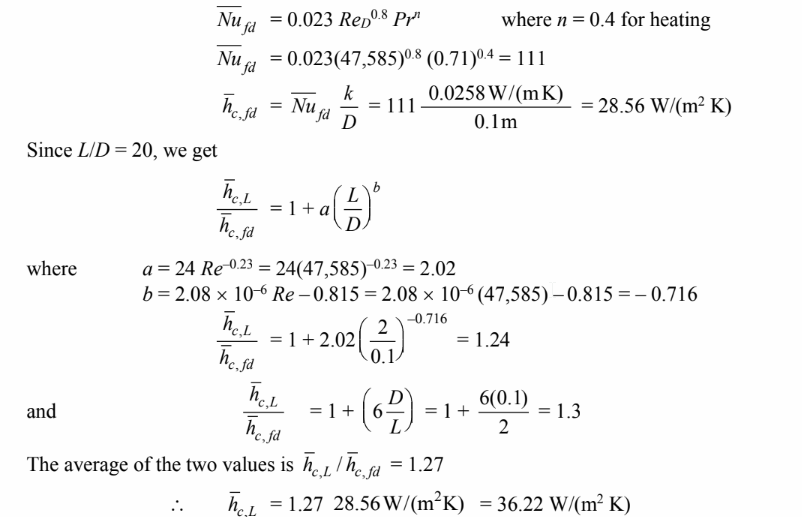
(a) Therefore, entrance effects may be significant.
(b) The outlet temperature is found by rearranging
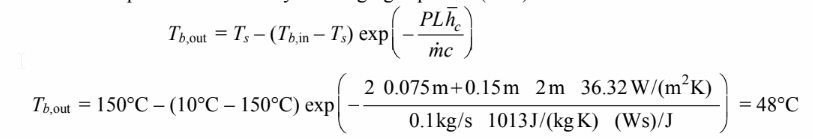
No further iteration is needed since the result is close to the initial guess.
(c) The rate of heat transfer is given by

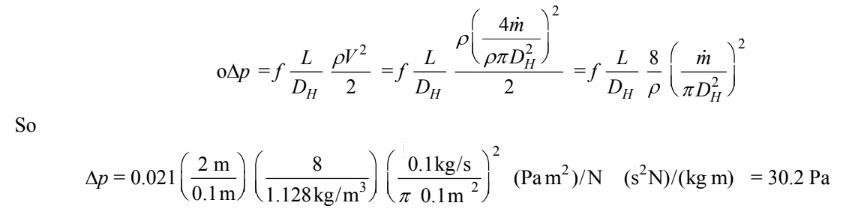
(d) The friction can be estimated from the lowest line for Figure 7.7: Re = 47,585 ? f ? 0.021. The
pressure drop is given by
You might also like to view...
The oblateness of the jovian planets' disks refers to their ________ equatorial diameters, compared to the polar diameters
Fill in the blank(s) with correct word
Which one of the following quantities is at a maximum when an object in simple harmonic motion is at its maximum displacement?
a. speed b. acceleration c. kinetic energy d. frequency
When a vapor condenses into a liquid, its temperature
A) insufficient information, cannot answer B) rises. C) stays the same. D) falls.
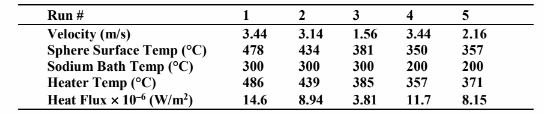
Determine how well the above data are predicated by the appropriate correlation given in the text. Express your results in terms of the per cent difference between the experimentally determined Nusselt number and that from the equation.
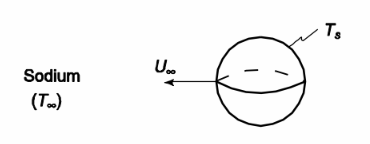
An experiment was conducted in which the heat transfer from a sphere in sodium was
measured. The sphere, 0.5 in. in diameter was pulled through a large sodium bath at a
given velocity while an electrical heater inside the sphere maintains the temperature at a
set point. The following table gives the results of the experiment
GIVEN
A sphere is pulled through a sodium bath at a given velocity
Sphere diameter = 0.5 in. = 0.0127 m
Sphere temperature is kept constant
Experimental data given above
FIND
The standard deviation between the data and the appropriate correlation
SKETCH