Refer to the graph below, which shows the market for bicycles. S1 and D1 are the original supply and demand curves. D2 and D3 and S2 and S3 are possible new demand and supply curves. Starting from the initial equilibrium (point 1), what point on the
graph is most likely to be the new equilibrium after a sharp increase in traffic accidents involving cyclists, and the payment of subsidies to bicycle producers?
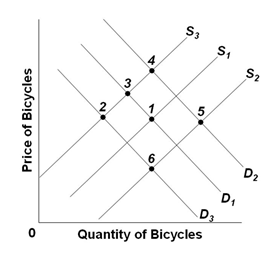
A. 3
B. 4
C. 5
D. 6
D. 6
You might also like to view...
A buyer’s response to a change in income is an example of a “change in demand.”
Answer the following statement true (T) or false (F)
The table below shows the weekly demand for hamburger in a market where there are just three buyers. PriceBuyer 1 Qd 1Buyer 2 Qd 2Buyer 3 Qd 3$6746597841510123211516 At a price of $6, the weekly market quantity demanded for hamburger is
What will be an ideal response?
If the world price for a good is above a nation's pre-trade equilibrium price, then the nation
A) will export the good. B) will import the good. C) will neither export nor import the good. D) cannot gain from trade. E) Both C and D.
When the total utility from consuming one good is maximized, marginal utility is
A. zero. B. minimized. C. positive. D. maximized.