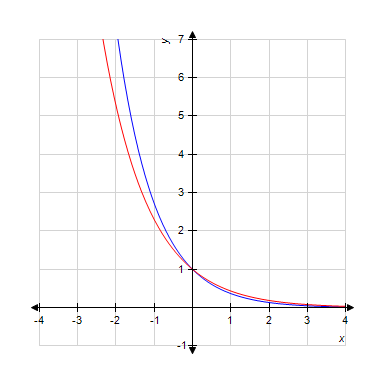
Given the graph of the functions  and
and  . Determine the color of the graph that corresponds to
align="middle" style="vertical-align: middle;" data-wiris-created="true" varid="variable_id_field" variablename="impvar_83176940760a4e73b290ea6f6" />.
?
?
Select the correct answer.
?
A. Blue
B. Red
Answer: B
You might also like to view...
Simplify the expression. Use positive exponents. Assume variables represent nonnegative numbers.
A. 3n B. 3 C. 3n5 D. 3n4
Perform the indicated operations on a calculator. Express the result with the proper accuracy and precision. Assume that all numbers are approximate. - 0.0756
A. 0.11 B. -0.038 C. -0.0383 D. 0.1129
Give the degree of the term.-5
A. 1 B. 0 C. 5 D. -5
The graph of the polynomial f(x) is shown in the figure. Estimate the zeros and state whether their multiplicities are odd or even.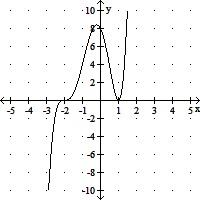
A. -2 (odd), 1 (odd) B. -2 (odd), 1 (even) C. -2 (even), 1 (even) D. -2 (even), 1 (odd)