The table below shows the cyclically adjusted budget surplus as a percentage of GDP over a five-year period.YearSurplus(+)11.0%20.930.540.251.5Refer to the above information. In which year was fiscal policy contractionary?
A. Year 5
B. Year 4
C. Year 3
D. Year 2
Answer: A
You might also like to view...
Rent controls and controls on other prices often aggravate the very problem they are intended to solve.
Answer the following statement true (T) or false (F)
Refer to Figure 12.5. If exchange rates are floating, the Fed decreasing its target inflation rate would best be represented by a movement from ________ in panel (a) and a corresponding movement from ________ in panel (b)
A) point A to point B; point X to point Y B) point C to point A; point X to point Y C) point D to point C; point Y to point X D) point B to point D; point Y to point X
Refer to the graph shown of a monopolistically competitive firm. If the firm maximizes profit, it will earn: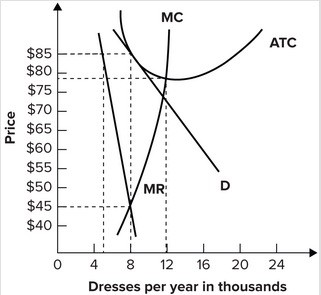
A. zero economic profit this year. B. $84,000 economic profit this year. C. $320,000 economic profit this year. D. $56,000 economic profit this year.
In the short-run Keynesian model where the marginal propensity to consume is 0.75, to offset a recessionary gap resulting from a $1 billion decrease in autonomous consumption, taxes must be:
A. decreased by $1 billion. B. decreased by $1.33 billion. C. increased by $1 billion. D. increased by $1.33 billion.