What were the total sales for the first 6 months of 2007?
Use the graph to answer the question.
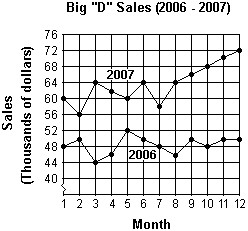
A. $302,000
B. $64,000
C. $366,000
D. $286,000
Answer: C. $366,000
You might also like to view...
Solve the problem.At one college, GPAs are normally distributed with a mean of 3.1 and a standard deviation of 0.5. What percentage of students at the college have a GPA between 2.6 and 3.6?
A. 68% B. 84% C. 95% D. 47.5%
The slope of a line is given. Determine the slope of the line perpendicular to the line whose slope is given.m = 
A. m = 
B. m = - 
C. m = - 
D. m = 
Divide.
A. 15 B. 5 C. 1.5 D. 0.5
Solve using a system of three linear equations.A basketball player scored 22 points in a game. The number of three-point field goals the player made was 14 less than three times the number of free throws (each worth 1 point). Twice the number of two-point field goals the player made was 13 more than the number of three-point field goals made. Find the number of free-throws, two-point field goals, and three-point field goals that the player made in the game.
A. 5 free throws; 1 two-point field goals; 7 three-point field goals B. 5 free throws; 7 two-point field goals; 1 three-point field goals C. 5 free throws; 8 two-point field goals; 3 three-point field goals D. 6 free throws; 7 two-point field goals; 4 three-point field goals