Provide an appropriate response.Sketch a scatter plot for a set of data points for which it would be appropriate to fit a linear function. Then sketch a second scatter plot for a set of data points for which it would not be appropriate to fit a linear function. For the second scatter plot, explain why it would not be reasonable to fit the data points to a linear function.
What will be an ideal response?
Examples will vary. The points in the first scatter plot should be clustered about a straight line. The points in the second scatter plot should be scattered about a curve.
You might also like to view...
Solve the problem.The number of new mini-vans sold by a particular salesperson during the month of March is exponentially distributed with a mean of 6. What is the probability that the salesperson will sell between 4 and 6 mini-vans in March?
A. 0.128 B. 0.110 C. 0.109 D. 0.146
Solve the problem.Find the area of the circular racetrack. Use 3.14 for ?. Round to the nearest foot. 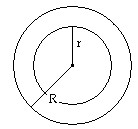

A. 13,816 ft2 B. 5024 ft2 C. 31,400 ft2 D. 45,216 ft2
The sides in the pair of figures are proportional. Find the missing length or lengths.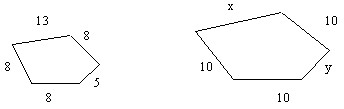
A. x = 16.25; y = 6.75 B. x = 16.25; y = 6.25 C. x = 15.75; y = 6.25 D. x = 16.5; y = 6.5
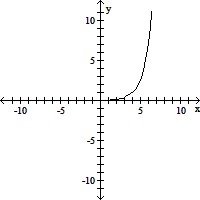
Sketch the graph and show all extrema, inflection points, and asymptotes where applicable.f(x) = ln x + 4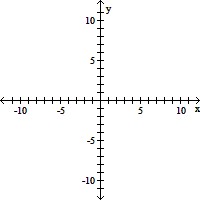
A. No extrema
No inflection points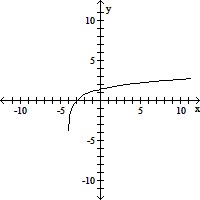
B. No extrema
No inflection points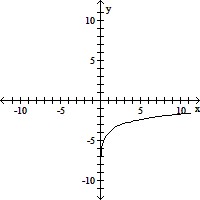
C. No extrema
No inflection points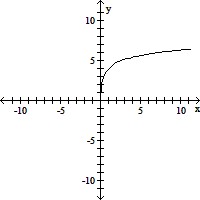
D. No extrema
No inflection points