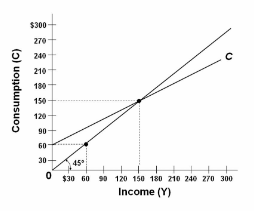
Refer to the diagram. The break-even level of income is:
A. zero.
B. $150.
C. $60.
D. $120.
B. $150.
You might also like to view...
When housing prices ________ as they did beginning in 2006 following the housing market bubble, most banks and other lenders tightened the requirement for borrowers, making it ________ for potential home buyers to obtain mortgages
A) fell; easier B) rose; easier C) rose; harder D) fell; harder
If the government pays a per-unit subsidy to the producer of a service, we would expect to see a(n) I. increase in the quantity demanded. II. decrease in the out-of-pocket price paid by consumers. III
increase in the quantity supplied by producers. A) I only B) both I and II only C) both II and III only D) I, II, and III
Suppose an economy produces only cranberries and maple syrup. In 2010, 50 units of cranberries are sold at $20 per unit and 100 units of maple syrup are sold at $8 per unit. In 2009, the base year, the price of cranberries was $10 per unit and the price of maple syrup was $15 per unit. For 2010,
a. nominal GDP is $1800, real GDP is $2000, and the GDP deflator is 90. b. nominal GDP is $1800, real GDP is $2000, and the GDP deflator is 111.1. c. nominal GDP is $2000, real GDP is $1800, and the GDP deflator is 90. d. nominal GDP is $2000, real GDP is $1800, and the GDP deflator is 111.1.
Banks hold reserves:
A. to increase profits. B. to meet depositor withdrawals and payments. C. only because the government requires them to hold reserves. D. to earn interest.