Show the short-run impact of the following factors on GDP using a graph of the aggregate goods and services market. Assume the economy was originally in long-run equilibrium
a. a stock market crash
b. a decrease in the real interest rate
c. a flood that destroys most agricultural crops
d. a decrease in resource prices
e. an increase in the labor force
f. an increase in the expected inflation rate
a. The stock market crash would decrease aggregate demand, leading to a decrease in both real GDP and prices in the short run.
b. A decrease in the real interest rate would increase aggregate demand, leading to an increase in both real GDP and prices in the short run.
c. The flood would decrease short-run aggregate supply, leading to an increase in prices and a decrease in real GDP in the short run.
d. A decrease in resource prices would increase short-run aggregate supply, leading to a decrease in prices and an increase in real GDP in the short run.
e. An increase in the labor force would increase both long-run and short-run aggregate supply, leading to an increase in real GDP and a decrease in prices in the short run. This point, however, will also be a long-run equilibrium.
f. An increase in the expected inflation rate will cause an increase in aggregate demand and a decrease in short-run aggregate supply. This will lead to an increase in prices and no change in real GDP in the short run.
You might also like to view...
Higher ________ in Canada than in the United States help(s) explain why ________ unemployment is higher in Canada than in the United States
A) prices; frictional B) unemployment benefits; structural C) unemployment benefits; frictional D) investment; structural E) prices; structural
A market that is shared equally by 100 firms would have a Herfindahl index of :
a. 1. b. 1,000. c. 500. d. 100. e. 50.
CEO is an abbreviation for
a. corporate executive organization b. category of endless output c. chief executive officer d. common efficient output e. corporate extra operation
Figure 10-4
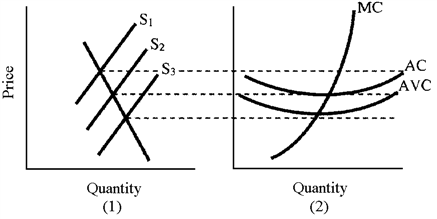
Figure 10-4 shows the industry's supply and demand curves in panel (1) and the cost curves of a firm in the industry in panel (2). At S3, the firm is
a.
going to shut down.
b.
incurring losses.
c.
earning zero economic profits.
d.
earning economic profit greater than zero.