Use the following graph of the demand for steak to answer the question below.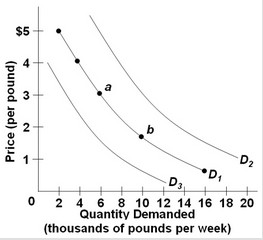 Refer to the above diagram and assume that steak is a normal good. Which of the following would shift the demand for steak from D1 to D3?
A. a decrease in consumer incomes
B. a decrease in the price of steak
C. an increase in consumer incomes
D. an increase in the price of steak
Answer: A
You might also like to view...
During George W. Bush's presidency
A. the job market was quite robust. B. The United States' federal budget deficit hit a record high. C. the federal budget surpluses in the last years of the Clinton presidency continued. D. we experienced a very high inflation rate.
When the price level is below the level at which the aggregate demand curve crosses the long run aggregate supply curve
A) there will be no price level change. B) there will be pressures that will lead to a shift of either the aggregate demand or the long run aggregate supply curves. C) total planned real expenditures will exceed actual real GDP, and the price level will increase. D) total planned real expenditure will be lower than actual real GDP, and the price level will increase.
If government tax revenues change automatically and in a countercyclical direction over the course of the business cycle, this would be called a(n):
A. expansionary fiscal policy. B. nondiscretionary fiscal policy. C. discretionary fiscal policy. D. political business cycle.
Refer to the information provided in Figure 2.4 below to answer the question(s) that follow.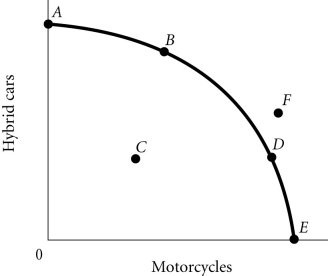 Figure 2.4According to Figure 2.4, Point A necessarily represents
A. only hybrid cars being produced. B. an unattainable production point. C. what society wants. D. the economy's optimal production point.