Graphically, producer surplus is measured as the area
A. under the demand curve and below the actual price.
B. above the supply curve and above the actual price.
C. under the demand curve and above the actual price.
D. above the supply curve and below the actual price.
Answer: D
You might also like to view...
Which of the following statements is FALSE?
A) The production possibilities curve shows the combinations of goods that can be consumed by a nation after trade and specialization begins. B) The production possibilities curve shows the combinations of goods that can be consumed by a nation before trade begins. C) The production possibilities curve shows the combinations of goods that can be produced by a nation after trade and specialization begins. D) The production possibilities curve shows the combinations of goods that can be produced by a nation before trading begins.
Which of the following is true?
i. A rational choice is made on the margin. ii. Microeconomics is the study of the national economy while macroeconomics is the study of the global economy. iii. Economists try to understand how the economic world works by testing normative statements. A) only ii B) only i C) only iii D) i and ii E) i and iii
Sherman Antitrust Act bans price discrimination that substantially lessens competition or injures particular competitors
a. True b. False Indicate whether the statement is true or false
For a given seller, the accompanying figure shows the relationship between the number of units produced and the opportunity cost of producing an additional unit of output. If the market consists of 50 identical sellers, each with the same opportunity cost as the seller depicted in the figure, then how many units would be supplied in the market at a price of $14 per unit?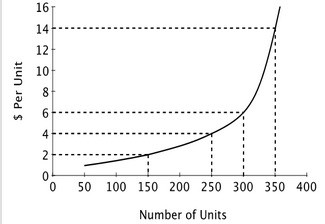
A. 175,000 B. 350 C. 17,500 D. 1,750