Solve the problem.The graph below shows the number of tuberculosis deaths in the United States from 1989 to 1998.
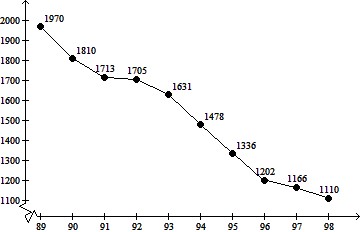 YearEstimate the average rate of change in tuberculosis deaths from 1991 to 1997.
A. About -60 deaths per year
B. About -1 deaths per year
C. About -460 deaths per year
D. About -120 deaths per year
Answer: D
Mathematics
You might also like to view...
Write an algebraic equation and use it to solve the problem.Four-sixths of a number is -28. What is the number?
A. The number is -  .
.
B. The number is -  .
.
C. The number is -42.
D. The number is -  .
.
Mathematics
Solve the system by graphing. If there is no solution or an infinite number of solutions, so state. Use set notation to express the solution set.

A. {(-1, -2)} B. no solution; ? C. {(-2, -1)} D. {(1, 2)}
Mathematics
Solve.45m2 + 93m + 47 = 0
A. 
B. 
C. 
D. 
Mathematics
Provide an appropriate response.Let f(x) =  (a) Does f'(0) exist? (b) Does f'(3) exist? (c) Does f'(-3) exist? (d) Determine all extrema of f.
What will be an ideal response?
Mathematics