Graph the linear function by plotting the x- and y-intercepts. x + y - 4 = 0
A. intercepts: (0, 4), (-8, 0)
B. intercepts: (0, 4), (8, 0)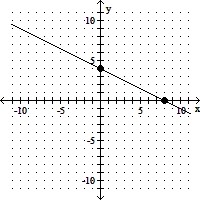
C. intercepts: (0, 4), (-4, 0)
D. intercepts: (0, -8), (8, 0)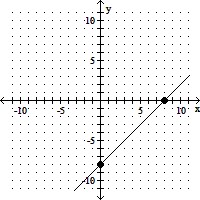
Answer: B
You might also like to view...
Solve. = 9
= 9
A. 80 B. 40 C. 20 D. -40
Solve the problem.A rectangular box with square base and no top is to have a volume of 32 ft3. What is the least amount of material required?
A. 36 ft2 B. 42 ft2 C. 48 ft2 D. 40 ft2
Determine the degree of the polynomial.8m3 - m2 - 4m + 13
A. 6 B. 5 C. 2 D. 3
Analyze the graph of the given function f as follows:(a) Determine the end behavior: find the power function that the graph of f resembles for large values of |x|.(b) Find the x- and y-intercepts of the graph.(c) Determine whether the graph crosses or touches the x-axis at each x-intercept.(d) Graph f using a graphing utility.(e) Use the graph to determine the local maxima and local minima, if any exist. Round turning points to two decimal places.(f) Use the information obtained in (a) - (e) to draw a complete graph of f by hand. Label all intercepts and turning points.(g) Find the domain of f. Use the graph to find the range of f.(h) Use the graph to determine where f is increasing and where f is decreasing.f(x) = -x2(x - 1)(x + 3)
What will be an ideal response?