Solve the problem.Use the graph to determine how many hours were needed to prepare for  .
.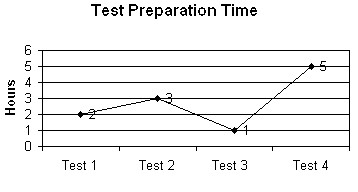
A. 5
B. 1
C. 2
D. 3
Answer: B
You might also like to view...
Assume there is a certain population of fish in a pond whose growth is described by the logistic equation. The growth parameter for this type of fish is r = 3.0.If the starting population is given by p0 = 0.2, then after one breeding season the population of the pond is given by
A. p1 = 0.6. B. p1 = 0.42. C. p1 = 0.16. D. p1 = 0.48. E. none of these
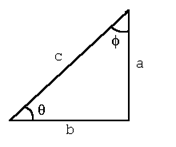
If é = 60 and b = 7, find a.
Solve the problem.The amount of a certain drug in the bloodstream is modeled by the function  , where y0 is the amount of the drug injected (in milligrams) and t is the elapsed time (in hours). Suppose that 10 milligrams are injected at 10:00 A.M. If a second injection is to be administered when there is 1 milligram of the drug present in the bloodstream, approximately when should the next dose be given? Express your answer to the nearest quarter hour.
A. 12:30 P.M B. 5: 30 P.M C. 5:45 P.M D. 3:45 P.M
Find the x- and y-intercepts of the graph of the equation. x = y2 - 3y - 10
A. x-intercepts: 2, -5; y-intercept: 10 B. x-intercept: -10; y-intercepts: -2, 5 C. x-intercepts: -2, 5; y-intercept: -10 D. x-intercept: 10; y-intercepts: 2, -5