The graph below shows the number of students enrolled in various courses at State University in spring 2000. Each bar represents a different course, and the height of the bar represents the number of students enrolled. Use the graph to answer the question.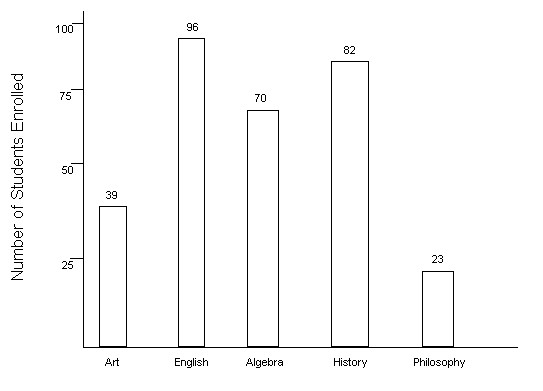 Write an inequality statement using < or > comparing the number of students enrolled in Algebra and Art.
A. 70 > 39
B. 70 ? 39
C. 70 ? 39
D. 70 < 39
Answer: A
Mathematics
You might also like to view...
Write an equation to describe the variation. Use k for the constant of proportionality.x varies jointly as the square of y and the square of z.
A. xy2z2 = k B. x = ky2z2 C. x = k + y2 + z2 D. x + y2 + z2 = k
Mathematics
Find the product and write the result in standard form.(2 - 4i)(-4 - 6i)
A. 16 + 4i B. 16 - 28i C. -32 + 4i D. -32 - 28i
Mathematics
The circle graph shows the results of the student council presidential election. The complete circular area represents 100% of the votes.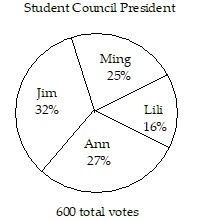 The circle graph shows what percent of the vote each person received.How many votes did Jim get?
A. 150 B. 162 C. 96 D. 192
Mathematics
Factor completely.2y4 - 72y2
A. 2y2(y - 6)2 B. 2y2(y - 6)(y + 6) C. y2(2y2 - 72) D. 2(y2 - 6y)(y2 + 6y)
Mathematics