Exhibit 6-13 Cost curves
?
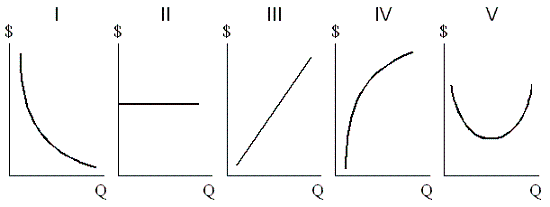
In Exhibit 6-13, TFC is shown by the graph labeled:
A. I.
B. II.
C. III.
D. IV.
Answer: B
You might also like to view...
Private markets will lead to a ________ vaccination rate because:
A. suboptimally low; the external benefit of being vaccinated would not fully be taken into account by decision makers. B. suboptimally high; the external cost of being vaccinated would not fully be taken into account by decision makers. C. socially optimal; price serves as a signal of marginal benefit and marginal cost. D. inequitable; health care services should not be provided based on ability to pay.
In the figure above, if there is no Ricardo-Barro effect, the government has a budget ________ because the ________
A) surplus of 0.2 trillion; SLF curve lies to the right of the PSLF curve. B) deficit of 0.2 trillion; SLF curve lies to the right of the PSLF curve. C) deficit of 0.4 trillion; SLF curve shows a smaller quantity of LF than the PSLF curve. D) surplus of 0.4 trillion; SLF curve shows a larger quantity of LF than the PSLF curve. E) surplus of -0.2 trillion; SLF curve lies to the right of the PSLF curve.
Suppose the country of Dingo experienced an economic trough in January 2011. We can conclude that
A) real GDP in Dingo was increasing in January 2011. B) an expansion occurred after January 2011. C) Dingo did not experience a recession in 2010. D) Dingo's potential GDP fell in 2011.
If the intersection of the IS curve with the horizontal axis comes at a level of output below the natural level of output, the Fed
A) can easily bring the economy back to the full-employment level of output. B) loses control of the economy. C) must use contractionary model policy to correct economic problem. D) must decrease money supply and ignore interest rates.