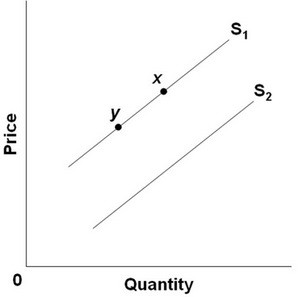
 Refer to the above diagram. A decrease in supply is depicted by a:
A. shift from S1 to S2.
B. move from point y to point x.
C. shift from S2 to S1.
D. move from point x to point y.
Answer: C
You might also like to view...
Table 7.1 exemplifies the principle of
A) diminishing returns. B) marginal costs. C) full employment equilibrium. D) real vs. nominal costs.
In an indifference curve/budget line diagram, generally when the price of a good increases, the consumer purchases ________ of the good and moves to a ________ indifference curve
A) less; lower B) less; higher C) more; lower D) more; higher
Workers at a local construction company are paid $32.50 per hour, and they have incorporated a 4 percent annual raise in their contracts to account for expected inflation
Explain how unexpected inflation of 2 percent will affect the real wages earned by these workers and the unemployment rate of these workers.
One of the effects of a change in disposable income could not be a(n)
a. movement up along the consumption function. b. movement down along the consumption function. c. change in the amount of consumption expenditures. d. upward shift of the consumption function.