Sketch the graphs of the functions f and g and find the area of the region enclosed by these graphs and the vertical lines  and
and  .
.
?

?
A. ?

 sq units.
?
B. ?

 sq units.
?
C. ?

 sq units.
?
D. ?

 sq units.
?
Answer: D
You might also like to view...
Solve the problem.Find an expression for the perimeter of the figure shown by adding the polynomials representing the lengths of the three sides.
A. 6x + 3 B. 6x + 9 C. 6x + 5 D. 6x3 + 18
Round to the indicated place value.Round to the nearest hundred: 368.327
A. 370 B. 400 C. 300
Use the data to make a histogram.The test scores in Mrs. Brooks' biology class are listed below.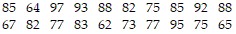
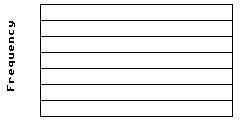 60-69 70-7980-8990-99 Test Scores
What will be an ideal response?
A clothing manufacturer is going to produce 10,000 women's blouses in a normal distribution of sizes with a mean of 8 and a standard deviation of 2.7. Given that the sizes are 2, 4, 6, 8, 10, 12, 14, 16, and 18, how many of each size should the manufacturer make?__________ blouses of sizes 6, 8 and 10;__________ blouses of sizes 4 and 12;__________ blouses of sizes 2,14 and 16;__________ blouses of size 18.
What will be an ideal response?