Solve the problem.The number of births in County A has been increasing in recent years. Using the information given on the bar graph for the years 1960 and 1990, find an equation to model the number of births y for the year x. Let x = 0 correspond to the year 1960.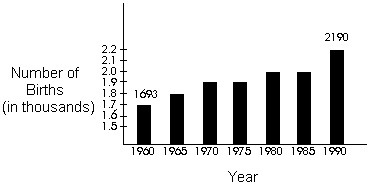
A. y =  x +
x + 
B. y =  x + 1693
C. y =  x + 1693
D. y =  x - 2190
Answer: B
You might also like to view...
Answer appropriately.According to data projections from a wildlife study, a certain region can support a population of 1480 coyotes when the human population in the region is 180,000. The coyote population falls by 15 for every additional 4500 people inhabiting the region. Express the coyote population in the region as a function c(x) where x is the number of people more than 180,000 inhabiting the region.
A. c(x) = -  + 181,480
B. c(x) = - 600x + 1480
C. c(x) = -2,632,500x + 1480
D. c(x) = -  x + 1480
Give the values of Xmin, Xmax, Ymin, and Ymax for the screen, given the values for Xscl and Yscl. Xscl = 2, Yscl; = 2
A. [-5, 5] by [-5, 5] B. [10, -10] by [10, -10] C. [5, -5] by [5, -5] D. [-10, 10] by [-10, 10]
Determine the equation of the vertical asymptote for the graph of this function, and state the domain and range of this function.f(x) = ln(x - 1) + 3
A. Vertical asymptote: x = -3; Domain: (-?, -3), Range: (-?, ?) B. Vertical asymptote: x = 3; Domain: (3, ?), Range: (-?, ?) C. Vertical asymptote: x = 1; Domain: (-?, 1), Range: (-?, ?) D. Vertical asymptote: x = 1; Domain: (1, ?), Range: (-?, ?)
Add. Write a mixed numeral for the answer.8 7
7

A. 16
B. 16
C. 17
D. 15