Table 30.5Output (units)Labor (units)Output (units)Capital (units)101201262562383863Assume that in Table 30.5 the cost of labor is $4 per unit and the cost of capital is $6 per unit. In Table 30.5, what is the cost efficiency of the second unit of capital?
A. 56 units per $1 of cost.
B. 9.33 units per $1 of cost.
C. 6 units per $1 of cost.
D. 36 units per $1 of cost.
Answer: C
You might also like to view...
The United States has experienced both budget surpluses and deficits since 2000.
In the short run, if prices are fixed, the aggregate supply curve is
A. vertical B. upward sloping. C. horizontal. D. downward sloping.
At the end of World War II,
A) tariffs around the world fell substantially. B) agricultural subsidies were significantly reduced. C) most nations began to apply tariffs uniformly across all industries. D) tariffs increased in low-income countries and fell a small percentage in high-income countries.
In Figure 29.1, the area that represents the consumer surplus under perfect competition is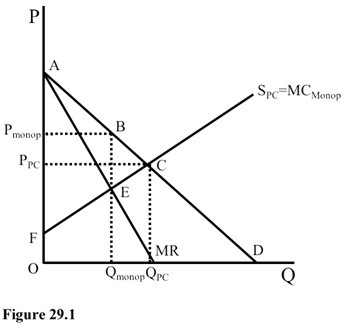
A. FPPCC. B. FPmonopolyBE. C. PmonopolyAB. D. PPCAC.