Graph the sequence  .
.
?
A. ?
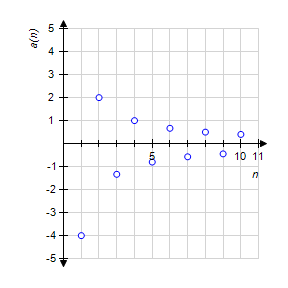
B. ?
C. ?
D. ?
E. ?
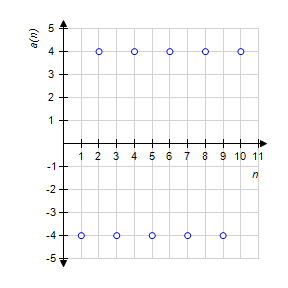
Answer: E
Mathematics
You might also like to view...
Use the indicated bin size to construct a frequency table for the set of data. Include columns for relative frequency and cumulative frequency.On a math test, the scores of 24 students were as follows: Use ten-point bins (60-69, 70-79, etc)
What will be an ideal response?
Mathematics
Use a percent proportion to answer the question.What is 80% of 500 universities?
A. 40,000 universities B. 4000 universities C. 400 universities D. 40 universities
Mathematics
Solve for base in the problem. Round to the nearest hundredth, if necessary.41 yards is .69% of yards.
A. 1.68 B. 168 C. 5,942.03 D. 59,420.3
Mathematics
Graph the function.f(x) =  log2x
log2x
A. 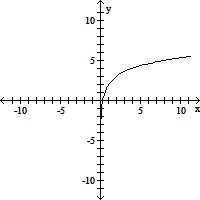
B. 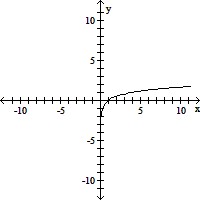
C. 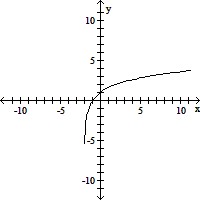
D. 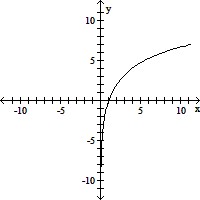
Mathematics