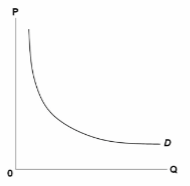
Refer to the diagram, which is a rectangular hyperbola, that is, a curve such that each rectangle drawn from any point on the curve will be of identical area. In comparing the price elasticity and the slope of this demand curve, we can conclude that the:
A. slope of a demand curve measures its elasticity.
B. elasticity of a demand curve measures its slope.
C. slope and elasticity of the curve are both constant throughout.
D. slope of the curve varies, but its elasticity is constant.
D. slope of the curve varies, but its elasticity is constant.
You might also like to view...
Refer to Figure 11.2. Suppose that Ca = 40, MPC = 0.8, I = 10. Equilibrium income is
A) 40. B) 50. C) 250. D) 400.
A rise in Durable Goods Orders should send bond prices __________ and stock prices __________
A) up; up B) up; down C) down; up D) down; down
If the U.S. price level increased relative to price levels in foreign countries, what would be the impact on domestic aggregate supply and aggregate demand curves?
a. the aggregate supply curve would shift outward and the aggregate demand curve would remain unchanged b. the aggregate supply curve would shift inward and the aggregate demand curve would remain unchanged c. the aggregate demand curve would shift outward and the aggregate supply curve would remain unchanged d. the aggregate demand curve would shift inward and the aggregate supply curve would remain unchanged e. the domestic aggregate demand and supply curves would remain unchanged
In addition to keeping interest rates too low for too long, the Fed also:
A. overestimated the importance of the housing sector for the whole economy. B. kept government spending too high for too long in the years leading up to the recession. C. ran too great of a budget surplus in the years leading up to the recession. D. underestimated the impact of a decline in the housing sector on the whole economy.