Construct a bar graph to represent the given data.The following table shows the number of inches of rainfall measured at City X during the following days.
What will be an ideal response?
Answers may vary. The following is a possible answer.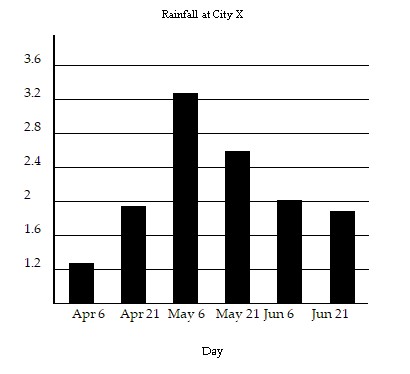
You might also like to view...
Solve the inequality. Write the solution set in interval notation and graph it.f + 1 < 9![]()
A. (-?, 8)![]()
B. [8, ?)![]()
C. (8, ?)![]()
D. (-?, 8]![]()
Find the equation of the transverse axis of the hyperbola.y2 -  = 1
= 1
A. y = 3x
B. y = 0 (x-axis)
C. y =  x
x
D. x = 0 (y-axis)
Solve the problem.The population of a city, in millions, since 1990 has grown at a rate of 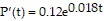 million people per year, where t is the number of years after 1990. If there were 1.96 million people in 2000, estimate (to two decimal places) the population in 2008.
A. P(18) ? -6.02 million B. P(18) ? 15.24 million C. P(18) ? 3.20 million D. P(18) ? 9.22 million
Factor the trinomial completely. If the polynomial cannot be factored, write "prime."x2 + x - 6
A. (x + 1)(x - 6) B. (x - 3)(x + 2) C. (x - 2)(x + 3) D. prime