Solve the problem.The following table shows the median number of hours of leisure time per week for Americans in various years.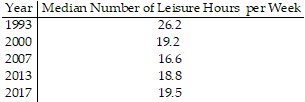 Let f(t) be the median number of hours of leisure time at t years since 1993. The data can be modeled by the quadratic model
 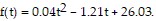 Use the model to estimate the year when the median number of hours of leisure time was the smallest.
A. 2008
B. 2009
C. 2007
D. 2006
Answer: A
Mathematics
You might also like to view...
Evaluate the line integral of f(x,y) along the curve C.f(x,y) = 2y2, C: y = e-x, 0 ? x ? 4
A. 

B. 

C. 1[2 - (e- 8 + 1)3/2]
D.  [2
[2 - (e- 8 + 1)3/2]
Mathematics
The problem tells by what factor and direction the graph of the given function is to be stretched or compressed. Give an equation for the stretched or compressed graph.y = x2 - 3 compressed vertically by a factor of 2
A. y = 2x2 - 6
B. y =  - 3
- 3
C. y =  -
- 
D. y = 4x2 - 3
Mathematics
Find the amount that results from the investment.$1,000 invested at 10% compounded annually after a period of 7 years
A. $1771.56 B. $1948.72 C. $2143.59 D. $948.72
Mathematics
Evaluate the expression for the given replacement values.2x - y for x = 9, y = -10
A. 3 B. 21 C. 28 D. 8
Mathematics