The Lorenz curve shows
A) how poverty rates change over time.
B) the percentage of population below the poverty line.
C) the degree of inequality in the income distribution.
D) the ratio of cash income to payments-in-kind.
Answer: C
You might also like to view...
Which of the following formulas is used to calculate the inflation rate?
A) inflation rate = 100 × B) inflation rate = 100 × C) Inflation rate = 100 × D) Inflation rate = 100 × E) inflation rate = 100 ×
Suppose the economy goes from a point on its production possibilities frontier (PPF) to a point below that PPF. Assuming that the PPF has not shifted, this could be due to
A) a gain of resources. B) a loss of resources. C) technological improvement in the production of both goods. D) an increase in unemployment of some resources.
The following graph shows the production possibilities curve for the economy with only two members, Silvia and Art. Silvia can produce either 50 pounds of beef or 2 computers per week, and Art can produce 100 pounds of beef or 1 computer per week. Both of them work 40 weeks per year.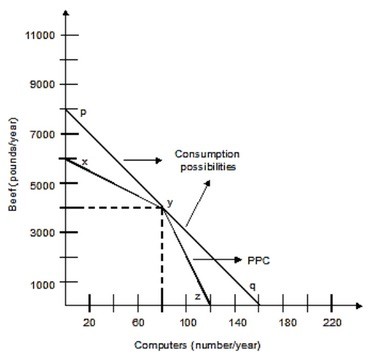 With the open trade economy, Silvia and Art can consume any combination of beef and computers from the line
A. XY. B. PQ. C. PY. D. XYZ.
Systemic risks would be most prevalent at larger banks like Bank of America and Citibank.
Answer the following statement true (T) or false (F)