Refer to the graph shown. When market supply shifts from S0 to S1, total producer revenue: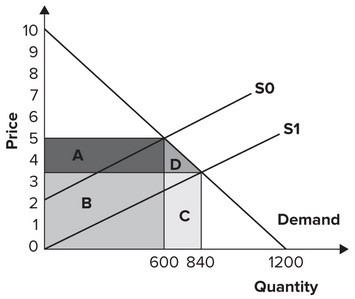
A. increases from $2,520 to $3,000.
B. decreases from $3,000 to $2,520.
C. increases from $1,260 to $1,500.
D. decreases from $1,500 to $1,260.
Answer: B
You might also like to view...
For a given supply curve, the more inelastic the demand for a good,
a. the more of an excise tax that is paid by sellers. b. the less an excise tax is shifted. c. the smaller the burden of an excise tax. d. the more of an excise tax that is paid by buyers. e. the smaller the increase in market price following imposition of an excise tax
The labor supply curve facing a monopsonist is
a. downward sloping b. upward sloping c. a horizontal line d. backward bending e. a vertical line
Transfer payments are not included in national income because: # randomize
A. Such payments are made to persons living abroad B. Double counting would result C. They are illegal D. There is no method to account for these
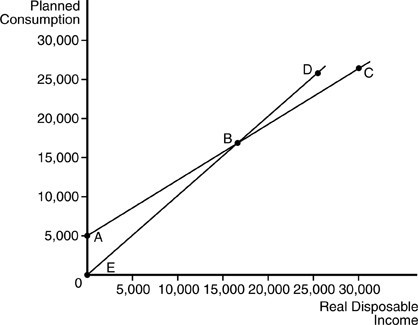 Refer to the above figure. If the MPC is unchanged and level of autonomous consumption increases, what occurs?
A. Line ABC will drop down. B. Line EBD will shift up. C. Line ABC shifts up. D. Line EBD rotates and becomes steeper.