Exhibit 7-2 Total revenue and total cost graph
?
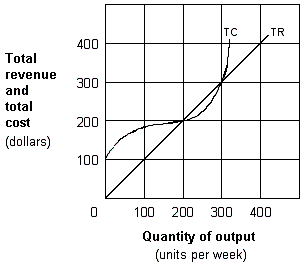
In Exhibit 7-2, economic profit for the firm is at a maximum when output per week equals:
A. 100 units.
B. 200 units.
C. 250 units.
D. 300 units.
Answer: C
You might also like to view...
Agricultural price supports in the United States
A) harm U.S. consumers, U.S. taxpayers, and foreign farmers and creates a deadweight loss. B) benefit U.S. taxpayers, U.S. farmers, and U.S. consumers. C) create gains to U.S. farmers that are at least as large as losses to U.S. consumers. D) decrease the deadweight loss and improve market efficiency. E) None of the above answers is correct.
“Correlation” is a measure of how one variable causes another to change.
Answer the following statement true (T) or false (F)
(I) Positive economics cannot determine how much income inequality should be present in a country. (II) Critics of government action to reduce income inequality argue that modifying the market process of income determination may create perverse incentives and hurt wealth creation
a. Both I and II are true. b. Both I and II are false. c. I is true; II is false. d. I is false; II is true.
What does the slope of a consumer's indifference curve represent?