Refer to the graph shown.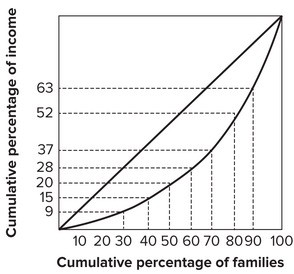 The richest 10 percent of the families earn:
A. 48 percent of the income.
B. 52 percent of the income.
C. 63 percent of the income.
D. 37 percent of the income.
Answer: D
You might also like to view...
________ emphasize(s) that changes in prices and interest rates are the main reasons behind fluctuations in the economy
A) The real business cycle theory B) Keynesian theory C) Ricardian theory D) Monetary theories
A flat LM curve implies that
A) an increase in government spending will change output by a relatively small amount. B) a decrease in taxes will change output by a relatively small amount. C) changes in government spending and taxes will have a large multiple effect on output. D) A and B.
As a result of moving more decision making from the center toward the periphery of the organization, typically
a. the flow of relevant information to the decision maker should be enhanced b. the flow of relevant information from the decision maker should be enhanced c. the incentives to make good decisions should be strengthened d. the incentives to make good decisions should be weakened
If the variable on the vertical axis increases by 20 and the variable on the horizontal axis increases by 5, the slope of the line is:
A. 0.25. B. 4. C. 15. D. 100.