Provide an appropriate response.To graph  on a graphics calculator, we must consider the union of the graphs of the two functions.
  and
and  . Using the graph of
  , explain (a) how the solution set of
  can be determined
graphically and (b) how it relates to the domain of the hyperbola.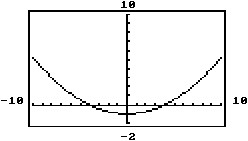
What will be an ideal response?
The graph of  lies above or on the x-axis in
  This set is the same as the domain of the given hyperbola.
You might also like to view...
Provide an appropriate response.Find the tripling time for money invested at p percent compounded continuously.
A. 
B. 
C. 
D. 
Find the limit if it exists. (9x2 - 2x - 6)
A. 914 B. 874 C. 886 D. 926
Solve the problem.The following table shows the rate of water flow (in gal/min) from a stream into a pond during a 30-minute period after a thunderstorm. Use Simpson's Rule to estimate the total amount of water flowing into the pond during this period. Round your answer to the nearest gallon.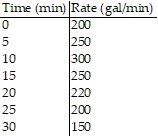
A. 7975 gal B. 6983 gal C. 6975 gal D. 6383 gal
Find the quotient.
A. 339 B. 339 R 12 C. 29 D. 339 R 29