Solve the problem.Data regarding the amount spent by a government department is represented in the following graph. Find the change in amount spent for the years shown in the graph. Is the graph a straight line?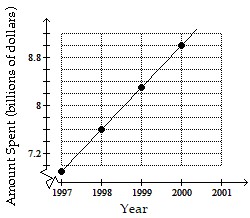
A. Change for each year: $0.18 billion; yes
B. Change for each year: $0.72 billion; yes
C. Change from 1998 to 1999: $0.72 billion, change from 1999 to 2000: $0.18 billion; no
D. Change for each year: $0.38 billion; yes
Answer: B
You might also like to view...
Two measurements are given. Find the absolute difference and then find the relative difference as a percentage. Assume that the first quantity is the compared value and the second quantity is the reference value. Round answers to the nearest tenth if necessary.Last year the total revenue for Clearline phone company was $13.6 million while the revenue for its competitor, the Speakmore was $8.6 million.
A. Absolute difference: $5 million Relative difference: 36.8% B. Absolute difference: $5 million Relative difference: 5.8% C. Absolute difference: $-5 million Relative difference: -36.8% D. Absolute difference: $5 million Relative difference: 58.1%
Find the center and radius and draw the graph.x2 + y2 - 12x - 2y + 33 = 0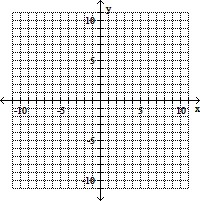
A. 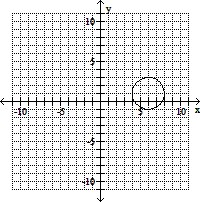
center (6, 1); radius 2
B. 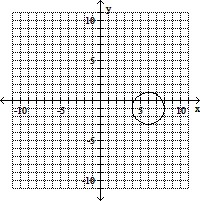
center (6, -1); radius 2
C. 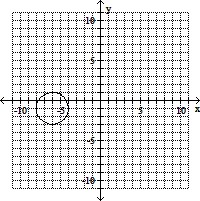
center (-6, -1); radius 2
D. 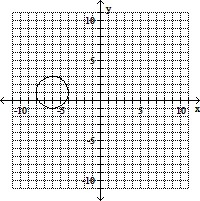
center (-6, 1); radius 2
Perform the indicated subtraction.-2.9 - (-2.1)
A. -0.8 B. -5 C. 5 D. 0.8
Find all cube roots of the complex number. Leave answers in trigonometric form.-125i
A. 5 cis 90°, 5 cis °210, 5 cis 330° B. 5 cis 30°, 5 cis °60, 5 cis 90° C. 5 cis 90°, 5 cis °180, 5 cis 270° D. 5 cis °210, , 5 cis 270°, 5 cis 330°