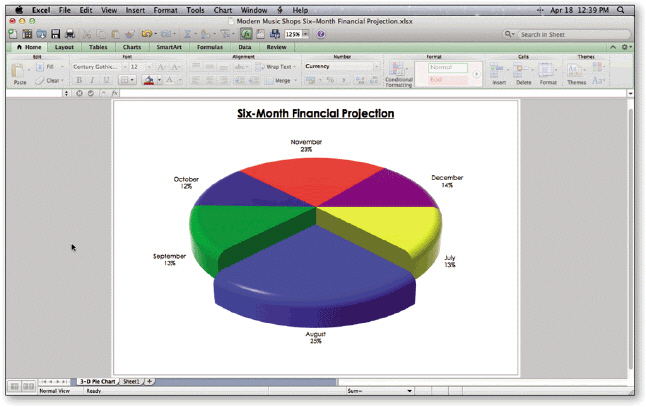
 Using the accompanying figure, identify the following chart elements: chart sheet, chart title, Pie chart, data series, category names, exploded slice, and data labels.
What will be an ideal response?
1. The chart sheet is a separate sheet named 3-D Pie Chart that contains only the chart.
2. The chart title is the Six-Month Financial Projection text above the Pie chart.
3. The Pie chart is the six-slice chart in the middle of the chart sheet that visually illustrates the data series.
4. A data series is the range of values being charted in the Pie chart.
5. The category names identify the slices of the Pie chart: the month names from July through December.
6. The August Pie chart slice is exploded or moved away from the other slices to draw attention to it.
7. The data labels supply the month name and percentage of the whole information for the Pie chart.
You might also like to view...
display a Vect object - labeling each component
What will be an ideal response?
Which of the following is not a common example of a blank template design?
A) Ion B) Flow C) Special D) Facet
Which of the following is not a true statement concerning forms?
A. Forms are used to convey information on a collection of items. B. Most forms have a stylized format and are usually not in a simple row and column format. C. Every output form will be a data flow produced by a process on a DFD. D. Forms may be displayed on a video display and may be used for data display or data entry.
Which of the following is a possible result of failure to establish and maintain standards of due care and due diligence?
A. baselining B. legal liability C. competitive disadvantage D. certification revocation