Refer to the graphs below. They show the long-run average total cost (LRATC) for a product. For which graph would a firm experience first economies and then diseconomies of scale over its range of output?
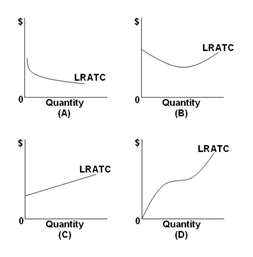
A. Graph A
B. Graph B
C. Graph C
D. Graph D
B. Graph B
You might also like to view...
The idea underlying Adam Smith's "invisible hand" is that people tend to behave in ways that go unnoticed in society
Indicate whether the statement is true or false
Multinational companies are concerned about exchange rate risk
Indicate whether the statement is true or false
Firms will continue to enter a competitive industry until: a. the supply curve is vertical
b. the market price falls below average variable cost. c. any economic profits have been competed away. d. all resources are fully employed.
The following is a total-product schedule for a resource. Assume that the quantities of other resources the firm employs remain constant.Units of ResourceTotal Product124242354464572If the firm's product sells for a constant $2 and the price of the resource is a constant $16, the firm will employ how many units of the resource?
A. 5 B. 4 C. 3 D. 2