The following graph shows the populations of the metropolitan areas of City X and City Y over six years. 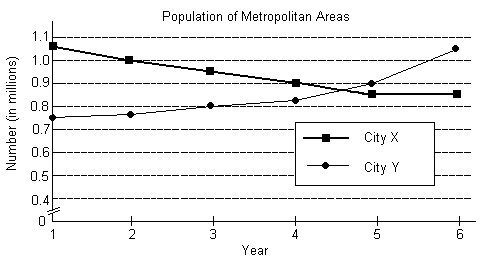 Express the solution of the system as an ordered pair.
A. approximately (3.9, 0.92)
B. approximately (1.2, 1.03)
C. approximately (3.1, 0.95)
D. approximately (4.6, 0.87)
Answer: D
You might also like to view...
Fill in the blank with one of the words or phrases listed below. Some words may be used more than once. 

 = original price - amount of discount.
A. Total price B. Sales price C. Amount of discount D. Sales tax
Graph the circle.x2 + y2 - 10x - 8y + 16 = 0
A. 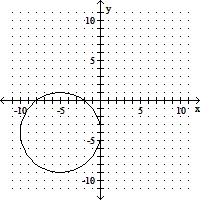
B. 
C. 
D. 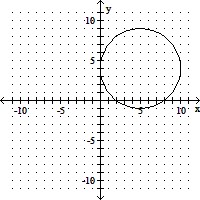
Answer the question.What does the digit 4 mean in the number 189,247?
A. 4 thousands B. 4 ones C. 4 tens D. 4 hundreds
Graph the function f(x) over the given interval. Partition the interval into 4 subintervals of equal length. Then add to your sketch the rectangles associated with the Riemann sum  , using the indicated point in the kth subinterval for ck.f(x) = cos x + 3, [0, 2?], right-hand endpoint
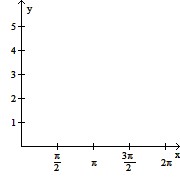
A. 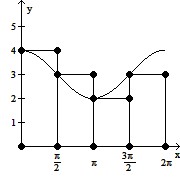
B. 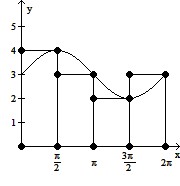
C. 
D. 