The table shows, for some particular year, a listing of several income levels and, for each level, the proportion of the population in the level and the probability that a person in that level bought a new car during the year. Given that one of the people who bought a new car during that year is randomly selected, find the probability that that person was in the indicated income category. Round your answer to the nearest hundredth. 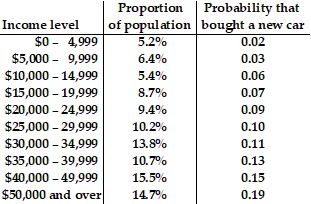 $0 - $4,999
A. 0.01
B. 0.03
C. 0.05
D. 0.02
Answer: A
Mathematics
You might also like to view...
Consider the normal distribution given below and assume that P is a point of inflection of the curve.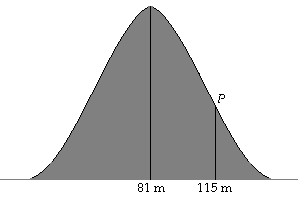 Find the third quartile Q3 of the distribution rounded to the nearest meter.
A. 115 m B. 149 m C. 150 m D. 104 m E. 58 m
Mathematics
The graphs of two functions f(x) and g(x) are given.Solve f(x) ? g(x).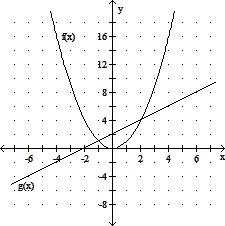
A. -1 ? x ? 2 B. x ? -1 or x ? 2 C. -1 ? x ? 1 D. x ? 0 or x ? 2
Mathematics
Use algebraic and/or graphical methods to solve the inequality. > 0
> 0
A. x < - 2
B. x > 0
C. x > - 2
D. x < - 
Mathematics
Find the product.(a - 11)(a + 11)
A. a2 + 22a - 121 B. a2 - 22 C. a2 - 22a - 121 D. a2 - 121
Mathematics