The bar graph shows the number of new residents in several towns during the years 1999 to 2001. Use the graph to answer the question. 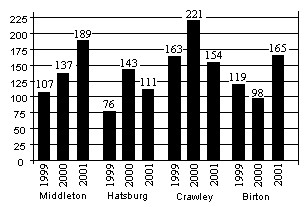 What was the increase in the number of new residents in Middleton from 1999 to 2000?
A. 32
B. 30
C. 52
D. 54
Answer: B
Mathematics
You might also like to view...
Graph the function.f(x) = e-x 
A. 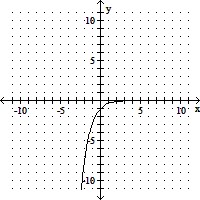
B. 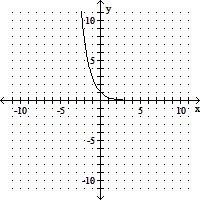
C. 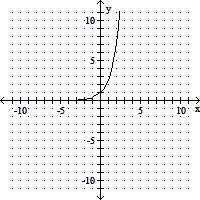
D. 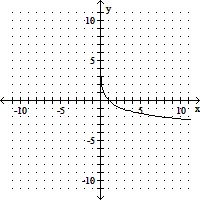
Mathematics
Find the linear approximating polynomial for the function centered at a.f(x) =  , a = 0
A. p1(x) = -  x
x
B. p1(x) =  x
x
C. p1(x) =  x
x
D. p1(x) = -  x
x
Mathematics
Solve the system of equations graphically. If the system does not have a single ordered pair as a solution, state whether the system is inconsistent of dependent. 3x - 2y = 4-6x + 4y = 7
A. Infinitely many solutions, dependent
B. (1, 2)
C. No solution, inconsistent
D. (2, 1)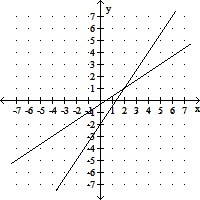
Mathematics
Multiply. 2
2
A. c2 + 
B. c2 + 
C. 2c +  c +
c + 
D. c2 +  c +
c + 
Mathematics